May 2015
Cover Story
Lake Whatcom Water Quality Deterioration Persists
by April Markiewicz
April Markiewicz is a toxicologist and the associate director at the Institute of Environmental Toxicology at Huxley College of the Environment at Western Washington University, as well as president of the People for Lake Whatcom Coalition.
This story u
The city of Bellingham just mailed out its annual 2014 Water Quality Report pamphlet (required by the federal government) to the approximately 100,000 residents in Bellingham and half of Whatcom County who use the lake as their drinking water source. The report, however, doesn’t focus on the quality of the lake water but rather on the filtered, treated and disinfected water that comes out of our household faucets.
According to the report, our tap water is very clean and in full compliance with state and federal water quality standards. Lake Whatcom, the source of that water, is not so clean and has been listed as an impaired water body under section 303d of the Clean Water Act. So, although our tap water is clean, there are times during the year when it has a distinctive “flavor” because of conditions in the lake from which it is drawn.
Background
We have to remember that it has only been in the last 100 years that Lake Whatcom has become the primary drinking water source for Bellingham and surrounding areas of the county. Before then the lake and its surrounding watershed were utilized primarily for extensive commercial (mining, logging, fishing, saw mill operations) and recreational (swimming, boating, fishing) activities. These activities caused impacts to the lake’s water quality, especially in the north end of the lake where many were concentrated.
Today, logging, mostly by private timber companies, is the primary commercial activity remaining in the watershed. Even those activities will diminish now that 8,800 acres of land in the watershed, formerly leased to logging companies by the Washington Department of Natural Resources, are now back under county management as part of its park system. They will be open for low impact public recreational purposes. Logging in the watershed, however, still takes place. Deforested hillsides and a legacy of poorly constructed logging roads on the watershed’s steep slopes have increased soil erosion into the lake and created unstable slopes prone to landslides.
The main driver affecting Lake Whatcom water quality, however, is residential development in the watershed. Impervious surfaces such as roofs, patios and driveways facilitate the rapid flow of rainwater to the lowest part in the watershed, i.e., the lake basin. In that rainwater are fertilizers and pesticides used on lawns, gardens and landscaping, soil particles from gardening and construction activities, heavy metals from cars, hydrocarbons (oil, grease, gasoline) from cars, mowers, boats, jet skis and roofing material, and fecal bacteria from pets, hobby farms and unmaintained septic systems.
Recreational activities in the watershed and on the lake are also contributing contaminants that are affecting water quality. For example, gasoline was detected in Lake Whatcom water in 1999 and components of it (benzene, toluene, ethyl benzene, and xylenes, i.e., BTEX) were subsequently detected in the tap water (Wendling, 2004). The cyclic pattern of gasoline concentrations in raw and treated water revealed the source to be from recreational boating and jet skis rather than storm water runoff. The last time these data were collected was in 2004, and since then the city has banned the use of two-stroke engines on the lake which are significant sources of unburned fuel in the water column.
The city filters and treats the lake water before it is disinfected and distributed to our taps, but some of these contaminants are unaffected and show up in our drinking water. However, the concentration of these contaminants in our tap water is very low and at acceptable levels in full compliance with the Safe Drinking Water Standards. The 2014 Water Quality Report is a great resource for providing data on what and how much has been measured in our tap water and how those amounts compare to Safe Drinking Water Standards.
That said, recreational boating also carries an emerging threat of invasive species getting into our drinking water source via transport on the hulls of boats and propeller blades. They can outcompete native species for resources and disrupt food webs, physically damage docks and water intake pipes and impart taste and odor problems to our drinking water. To prevent them from entering the lake, mandatory inspections of all watercraft, including kayaks and canoes, are now required at the public boat launches.
Status of the Lake
Lake Whatcom is therefore unique in that it has never been protected from commercial activities, residential development and recreational uses as most drinking water sources are. As such, it is subject to a plethora of ongoing challenges that continue to degrade the lake’s water quality, although at a slower rate than before.
We know the lake is degrading and almost 60 years of water quality data show the trend. That data has been collected thanks to the foresight of city leaders back in the 1960s who initiated long-term monitoring of water quality in Lake Whatcom.
Western Washington University has been funded by the city to collect, analyze and report on the data collected each year. The data collected include temperature, pH, dissolved oxygen, conductivity, turbidity, nutrients (phosphorus and nitrogen) and other water quality parameters.
Samples are collected from the surface to the bottoms of the deepest areas of each of the three subbasins that comprise Lake Whatcom. The northernmost Silver Beach area basin, Basin 1 (sample Site 1) is approximately 100 feet deep. The Geneva area basin, Basin 2 (sample Site 2) is 40-60 feet deep. Basin 3 (sample Site 3 (north part of basin) and Site 4 (south part of basin) is 328 feet deep and contains 96 pecent of the lake’s total volume.
Since the mid-1980s, Dr. Robin Matthews, director of the Institute for Watershed Studies at Western, has lead the long-term monitoring project and provided the results in the Lake Whatcom Monitoring Program Annual Reports. By the early 2000s, water quality data indicated alarming changes in the productivity of the lake. By 2004/2005, water quality conditions in the lake were not only continuing to deteriorate but were doing so at an accelerated rate with the entire lake showing signs of water quality degradation. (Matthews et al., 2006)
The main culprit was identified as phosphorus, a nutrient essential for life, but which in excess can cause unlimited algal growth that blocks light from penetrating the water column, lowers dissolved oxygen levels, imparts odor and taste problems in drinking water, and clogs the intake filters of water treatment facilities. Phosphorus was found to be entering the lake in dissolved form in storm water runoff as well as on soil particles from logged areas and residential construction sites in the watershed.
Over the last 10 years, dedicated efforts on the part of the city, county and the Lake Whatcom Water and Sewer District are making a difference. In 2013, the city reported phosphorus loadings to the lake had decreased by approximately 35 pecent. The Washington State Department of Ecology has mandated an 87 pecent reduction (Pickett and Hood, 2008). The good news is that water quality degradation has slowed, if not stabilized, for some parameters over the last several years (Matthews et al., 2013; 2014). Local and state officials are quick to acknowledge, however, that much more work is needed.
2013/2014 Data
The most recent data indicate that some water quality parameters are staying the same, whereas others are showing continued decline. Of concern is the early spring we had last year that resulted in warmer weather over a much longer time frame. Though most Bellinghamsters celebrated the better weather, the effects on lake processes tended to exacerbate unappealing water quality problems. Warmer temperatures caused Lake Whatcom’s three basins to thermally stratify sooner and remain stratified longer, well into November and early December.
The longer time the lake’s basins are stratified causes higher concentrations of metals (including mercury and phosphorus), ammonium, hydrogen sulfide (rotten egg odor), and organic compounds to be dissolved out of the sediments and into the overlying unoxygenated bottom water in Basins 1 and 2. In late fall, the lake water cools, destratifies and mixes thoroughly again, thus distributing these contaminants throughout the lake. Fish kills as well as taste and odor problems in drinking water can result.
This year is shaping up to be like last year, weather-wise. Warm temperatures in January and February are already causing Basin 1 to show early signs of thermal stratification, which normally doesn’t occur until March/April (Matthews pers. comm., 2015). There is concern about the effects of two back-to-back warmer years on Lake Whatcom water quality. If this weather pattern becomes the new norm for our region, there may be untold effects on Lake Whatcom, as well as other natural resources, including the marine nearshore areas of our county.
For now, the following are the status of some of the more important water quality indicators reported in the 2013/2014 Lake Whatcom Monitoring Program Annual Report (Matthews et al., 2015):
Surface water temperatures were warmer than historic values throughout most of the year, and the August surface temperatures in Basin 3 were among the highest in the 1988–2014 record
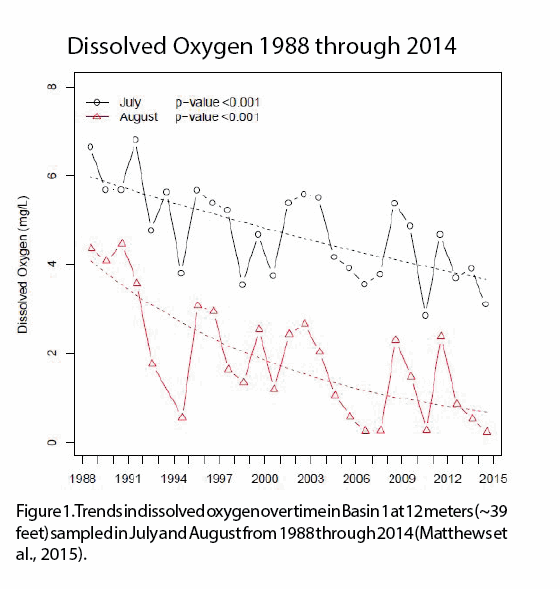
Dissolved oxygen levels dropped to < 1 mg/L from 11 meters (~36.3 feet) down to the bottom in Basin 1 by August (see Figure 1).
In 2014, hydrogen sulfide levels were slightly higher in Basin 1 and more than double what they were in 2013 in Basin 2.
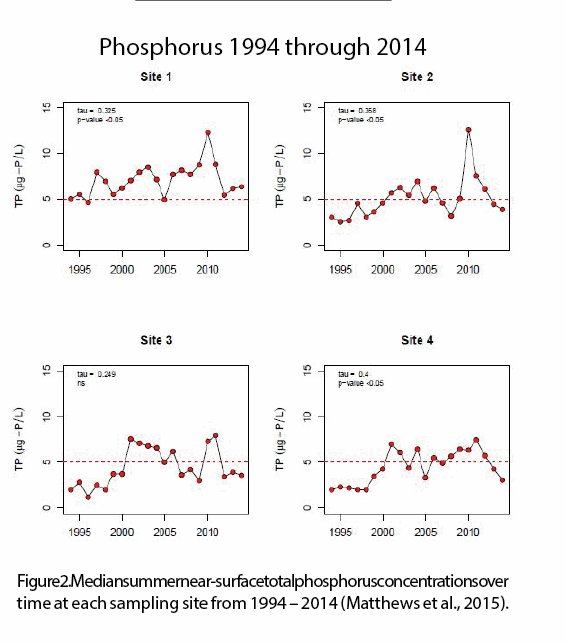
Total phosphorus (TP) levels were similar to 2013 data and continue to decline in Basins 2 and 3 from highs measured in 2010 and 2011, respectively. Basin 1 had a slight increase in TP (see Figure 2).
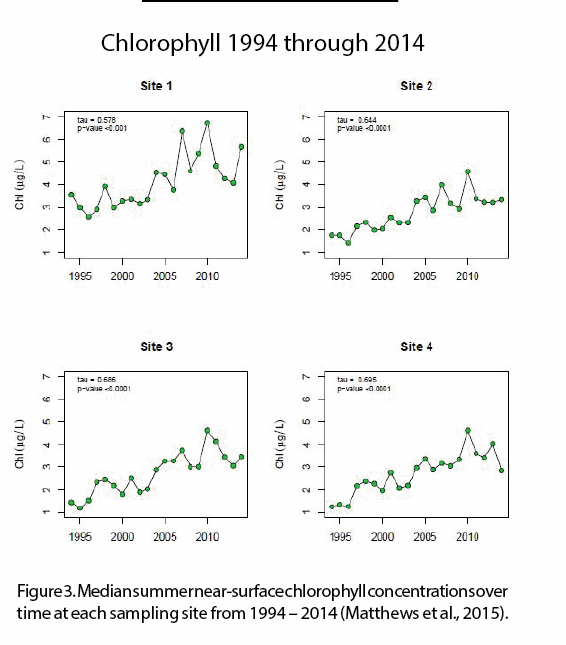
Chlorophyll (Chl) concentrations increased dramatically in Basin 1, though less so in Basin 2 and the northern part of Basin 3. Only in the south part of Basin 3 had chlorophyll levels declined (see Figure 3). Cell counts, however, continue to show an increase in green algae.
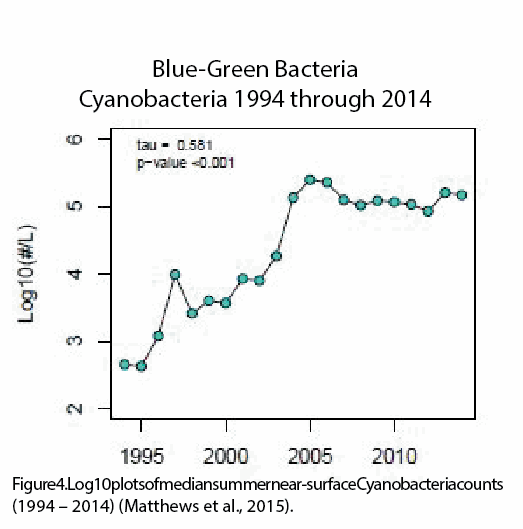
Bluegreen bacteria (Cyanobacteria) populations were at higher levels in Basin 1and in the northern part of Basin 3. Basin 2 and the south part of Basin 3 had slight declines. The log transformed plotted data emphasizes the stabilization of population numbers over the last 10 years (see Figure 4).
Algal blooms during the summer months again clogged the city’s water treatment filters for a sixth year in a row causing poor water filtration rates at the water treatment facility. Mandatory water restrictions implemented in the spring enabled the city to provide sufficient quantities for both household and business uses.
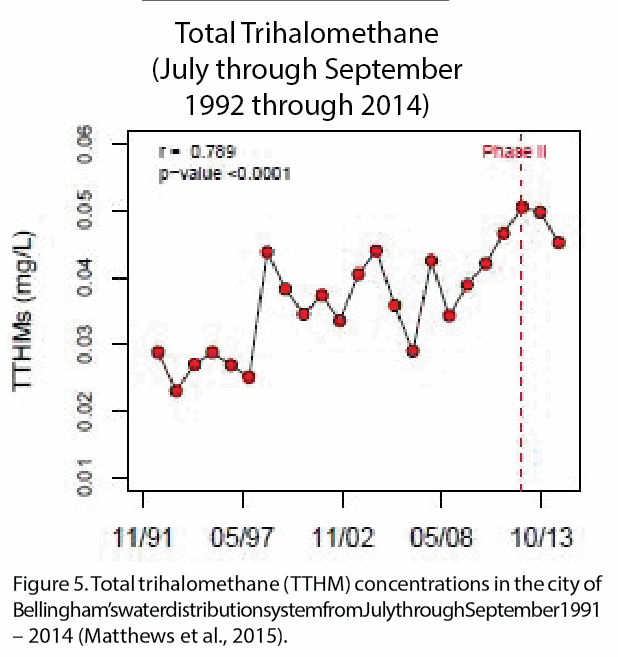
Trihalomethanes (THMs), which are known carcinogens created during the disinfection process of water treatment continue to decline from the high measured in 2012 and remain below the maximum contaminant level of 0.08 mg/L (see Figure 5). (Note: The number of sites used to calculate the quarterly averages increased from four to eight in 2012 (vertical dotted line).
Take Home Messages
The good signs are that phosphorus levels continue to remain low and are declining in Basins 2 and in the south end of Basin 3, which contains the largest volume of water. Dissolved inorganic nitrogen, however, is continuing to decline throughout the lake, a clear indication that bacterial and algal productivity are increasing.
Cyanobacteria numbers continue to be relatively constant, although green algae has increased. Efforts on the part of the city, county, and Lake Whatcom Water and Sewer District to control particle and phosphorus loadings are helping to keep these water quality parameters from getting worse. On a final note, climate change may add an unknown factor to water quality degradation in Lake Whatcom.
Only time will tell.
References
• Matthews, R.A., M. Hilles, J. Vandersypen, R.J. Mitchell, and G.B. Matthews. 2006. Lake Whatcom Monitoring Project 2004/2005 Final Report. Prepared for the city of Bellingham, Bellingham, WA. March 30, 2006. 465 pages.
• Matthews, R.A., M. Hilles, J. Vandersypen, R.J. Mitchell, and G.B. Matthews. 2014. Lake Whatcom Monitoring Project 2012/2013 Report. Prepared for the city of Bellingham, Bellingham, WA. March 6, 2014. 293 pages.
• Pickett, P. and S. Hood. 2008. Lake Whatcom Watershed Total Phosphorus and Bacteria Total Maximum Daily Loads – Water Quality Findings. Publication No. 08-03-0xx, Draft – 4-21-08. Washington State Department of Ecology, Olympia, WA, 71p.
• Wendling, P. 2004. BTEX.xls data file obtained from Peg Wendling, City of Bellingham Public Works Water Department, July 13, 2004.
